Contrary to what the headline suggests, this post is not about how to protect procurement agency staff from mosquito bites by installing wire-mesh screens in their office windows. Wikipedia covers that subject nicely. This post is instead about a different kind of screen: the ones that protect citizens from being stung by cartels.
Cartel screens are software programs that analyze bids received on public tenders for patterns suggesting the companies bidding agreed to rig the bid. Putting in a cartel screen is no harder than mounting a wire-mesh screen in an open window, and because the harm from a cartel’s sting is much, much greater than that from a garden variety bug bite, the benefits from cartel screens are far greater. To see how easy it to install a cartel screen and how much damage it can prevent, consider this example.
The decision has been made to construct a new road which engineers estimate will cost $57,300,000 million. As required by statute, the procurement agency advertises the tender and receives these four bids in response –
Company A: $57.4 million

Company B: $62.0 million

Company C: $67.8 million

Company D: $73.5 million
The bids are all from qualified companies, properly documented, and responsive, and accordingly the contract is awarded to Company A, the low bidder. On its face, this appears to be a “clean” procurement. Now put in a simple screen.
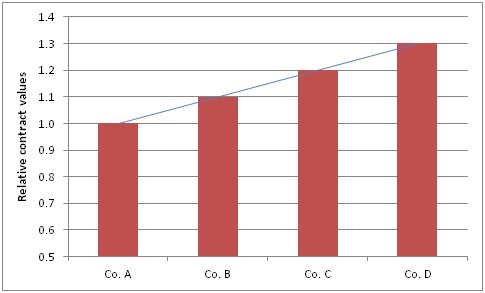
The chart above compares the four bid prices to the estimated price. For each, the price the company bid is divided by the estimated price yielding what Tóth and colleagues in their paper on cartel screens term the “relative contract value.” Since the Company A bid is in round numbers equal to the estimated price, dividing its bid price by the estimated price ($57 million/$57 million) produces 1. Because the other three companies’ bids were greater than the estimate, dividing their bids by the estimated price produces relative contract values greater than 1. For Company B it is 1.1, for Company C the number is 1.2, and for Company D 1.3.
The procurement doesn’t look quite so clean now. The pricing pattern in fact looks quite suspicious. The bid by B is 10 percent over the estimate, C’s bid is 20 percent over, and D’s 30 percent. What is the likelihood that this bid pattern is the result of the four companies separately and independently estimating the price at which they could build the road versus the likelihood that they agreed in advance that A would “win” by submitting the estimated price and each would submit a phony, or “cover,” bid in increments of ten percent above the estimate?
Granted the above is a hypothetical where the numbers were chosen to make a point, now consider the three charts below where the relative contract values from actual tenders are plotted, two from highway projects in California and one for a water treatment facility in a middle income country.
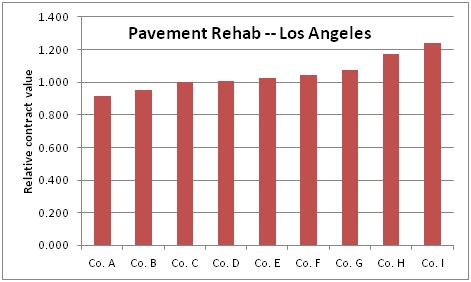
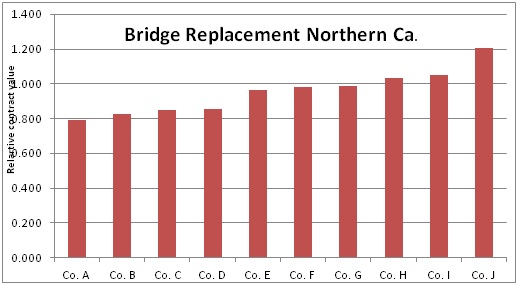

Of the three, which one raises suspicions? In which one is there no bid below the engineer’s estimate (an often rough calculation that doesn’t reflect all market factors)?
One difference between cartels screens and window screens it that the bugs never learn how to penetrate the screen. But cartels do. Once a cartel learns that a procurement agency is plotting relative contract values, members will take evasive action. Instead of increasing cover bids by 10 percent increments as in the example, members will vary the increments to disguise the collusion.
Fortunately, there is a second difference between cartel screens and window screens. While window screens continue to be nothing more than wire or plastic mesh stretched over a frame, the technology behind cartel screens has rapidly evolved. There now any number of sophisticated screens available to catch cartels before they sting the public no matter how well they try to disguise their corrupt scheme (here, here, and here for information).
Cartels continue to plague both developed and developing countries, jacking up prices on public contracts by an average of 20 percent and in some cases by as much as 100 percent (here and here). It is long past time for procurement authorities to install screens to catch cartels before they sting.

I request author’s explanations on the three charts.
Well done! Super interesting to see visualizations of some of the (car)telltale signs of collusion. It’s encouraging to see that the even simple calculations like percent differences can alert to suspicious behavior. In spite of the fact that the math is basic, it seems actually implementing screens is a challenge. I’d be interested to learn more about these roadblocks. I’d also be curious to see which countries or agencies are really excelling at screening.